


This tutorial will guide you through building effective queries and customising your data view for maximum efficiency. By the end of this tutorial, you will be able to:
Construct accurate queries to extract the specific information you need from your data.
Create customised data views based on specific user roles, data subsets, or other criteria.
Building Queries in Your Dataset
This step will guide you through building queries to find specific information within your datasets.
1. Accessing the Query Settings:
Navigate to the Datasets tab.
Select the dataset you want to work with.
Click the icon in the bottom right corner of the dataset screen to open the query settings screen.
2. Exploring the Query Settings:
The query settings screen provides several options to customise your data view:
Filter (1) and sort (2) your data
Hide (3), rearrange (4) and format (5) your column

You can also add a column stat and button to your query. More information could be found here.
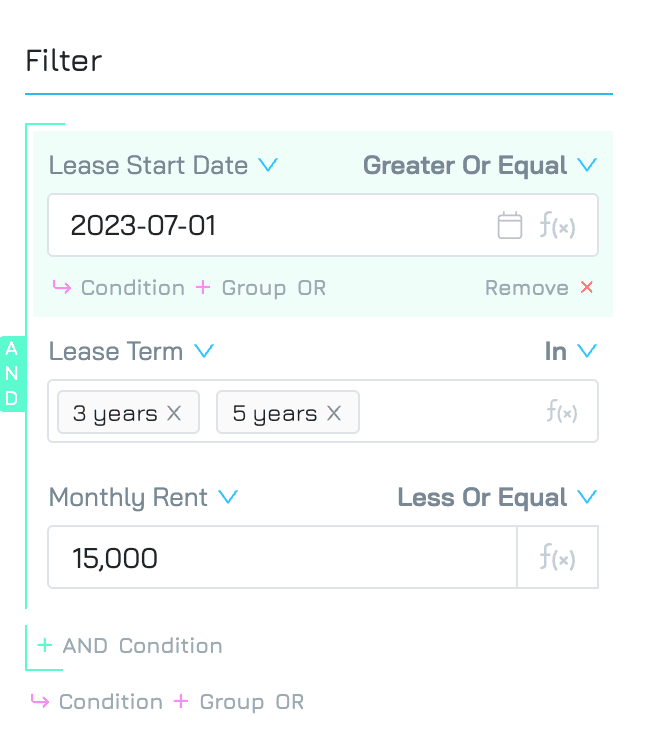
Filter data
This allows you to narrow down the dataset based on specific criteria. You can define conditions only to show rows that meet those requirements.
To add a filter:
Click + Condition to add a new filtering rule.
Select the field you want to filter from the dropdown menu. This field represents a column in your dataset.
Choose a comparator from the available options. Comparators define the condition you want to apply to the selected field. The available options will vary depending on the data type of the field.
Enter a value to compare with the chosen field. This value could be a number, text, or a date depending on the data type.
You can add multiple filters to create a more complex selection.
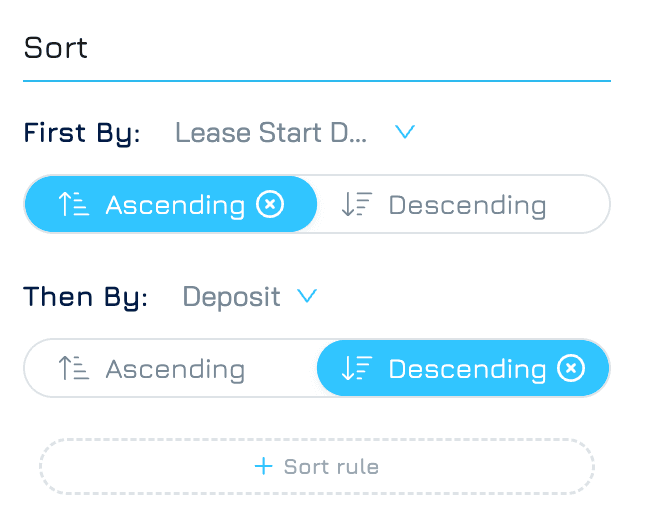
Sort Data
This allows you to organize the data in a particular order, making it easier to analyze trends or patterns.
To add a sort rule:
Click + Sort Rule
Choose the column you want to sort by from the available dropdown menu. This column defines the basis for ordering the data.
Specify the order: Select either ascending (A to Z, smallest to largest) or descending (Z to A, largest to smallest) order for the chosen column.
Engyn supports multiple sorts simultaneously. This is helpful when you want to organize the data based on two or more criteria. Click + Sort Rule to add another sort column. You could also drag and drop column headers to rearrange the sort order
Hide Columns
Click the eye icon next to a column name to hide it from the view. This helps focus on the most relevant information for your analysis. You can unhide columns by clicking the eye icon again.
Rearrange Columns
Hover your mouse over a column header. You should see a cursor that allows dragging. Click, hold, and drag the column to your desired position in the order.
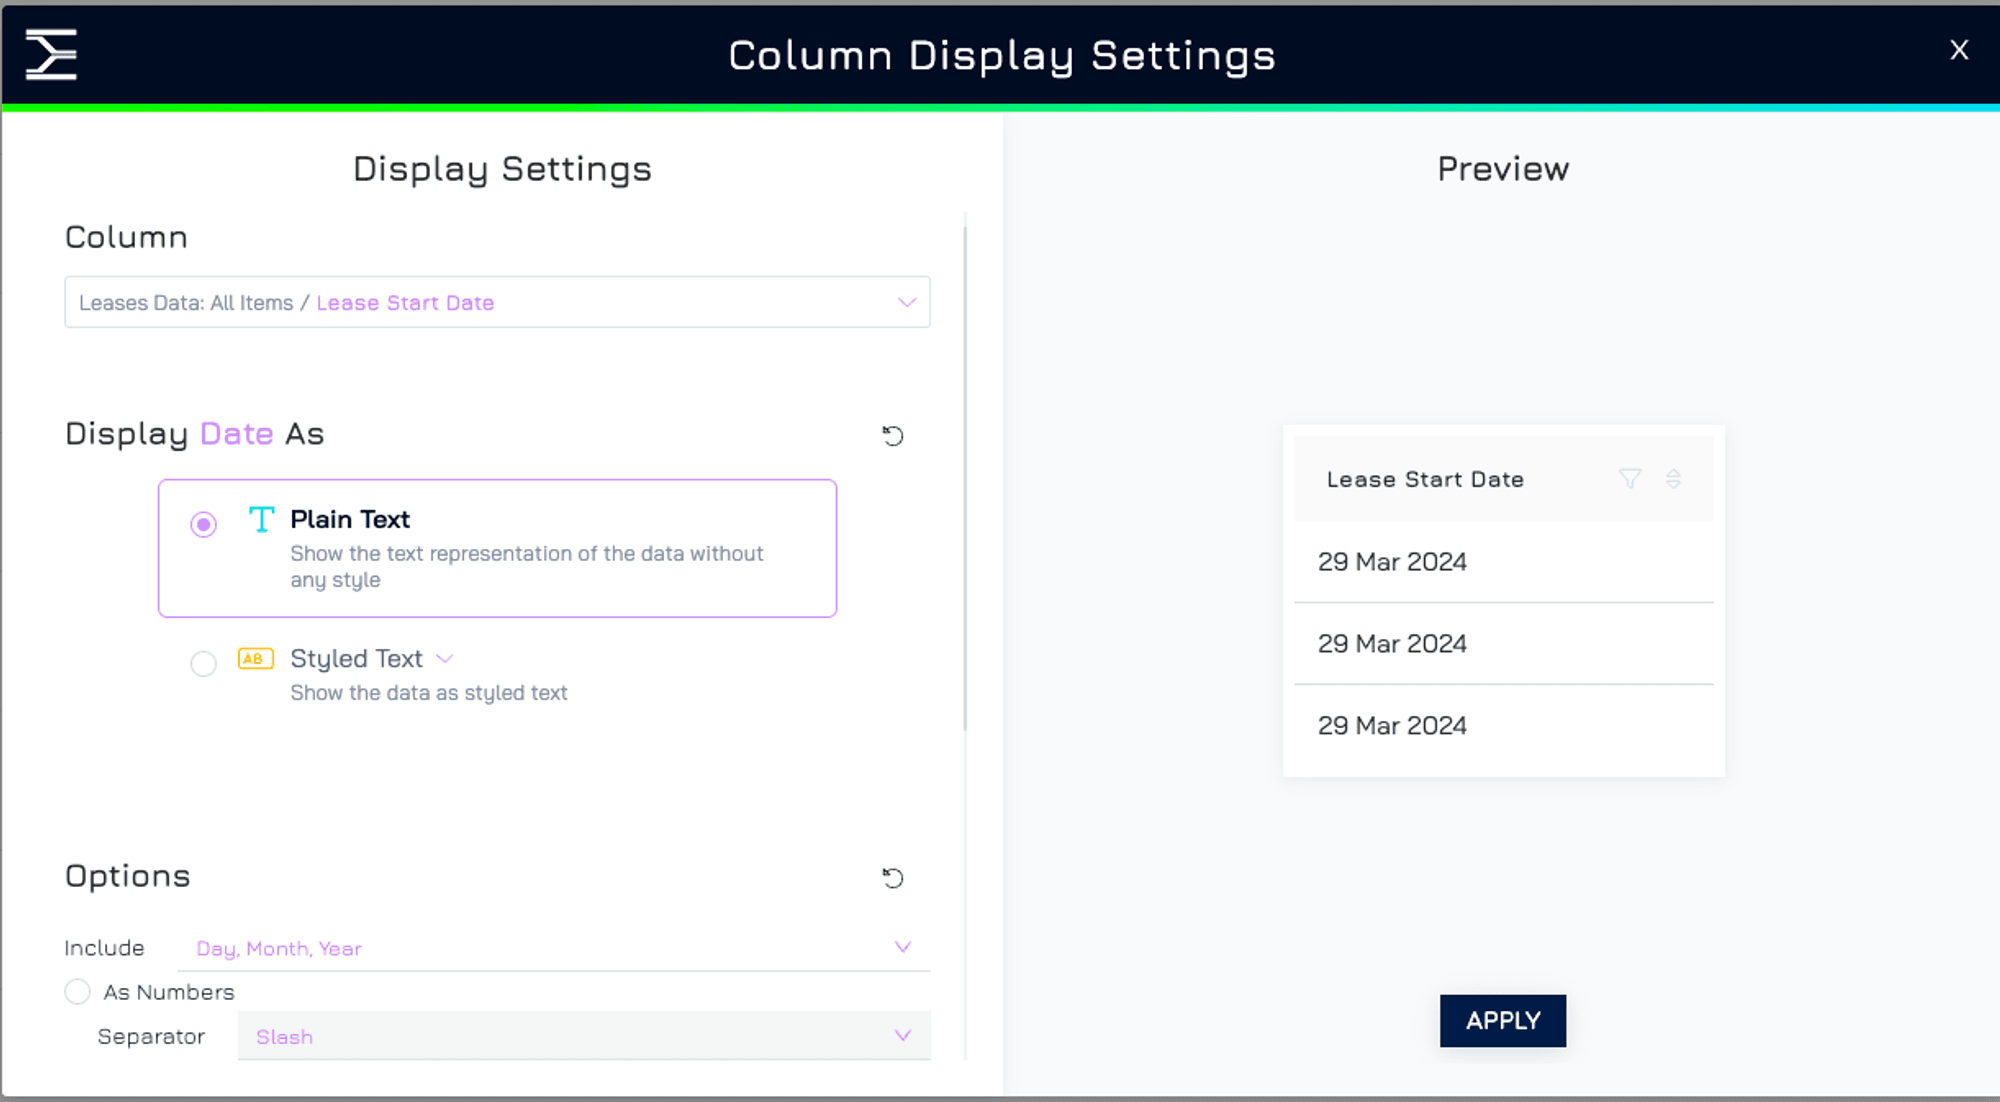
Format your data
Engyn provides formatting options to customize the appearance of your data within the table view, enhancing readability and emphasizing specific data aspects.
Click next to each column header to access column display settings.
Choose the options that best suit your needs. Engyn provides a variety of formatting options tailored to each column's data type.
Click Apply to save your settings for the selected columns.
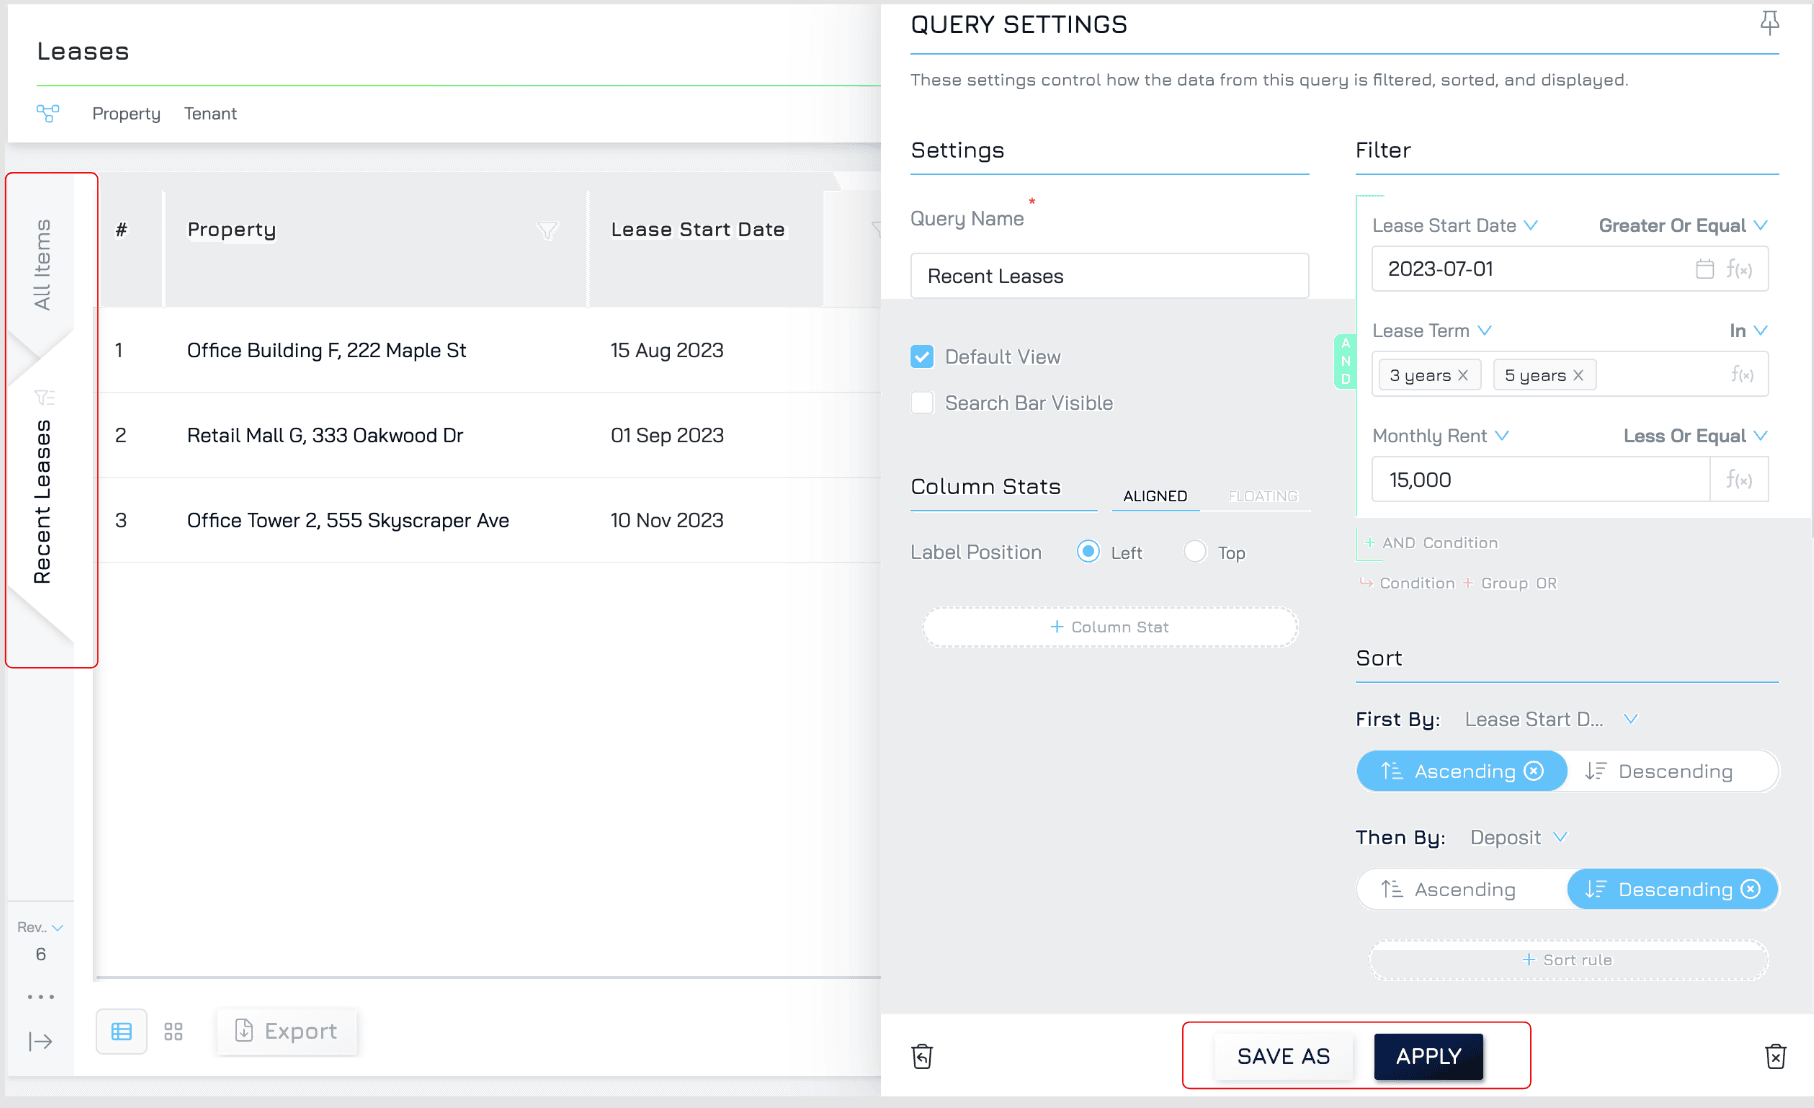
Applying and Saving Your Query:
Applying Changes:
Once you've finished customising your data view, click the "Apply" button to confirm your changes. This will update the dataset view based on your filters, sorts, and any hidden columns.
Saving Your Query as a View:
Engyn allows you to save your customised view as a named view for easy future access.
Click SAVE AS and enter a descriptive name for your query view. This name will help you identify the purpose of the view later.
Click SAVE to finalize the process. Your saved view will typically appear in the left panel of the dataset view within Engyn, allowing you to quickly switch back to your customized view whenever needed.
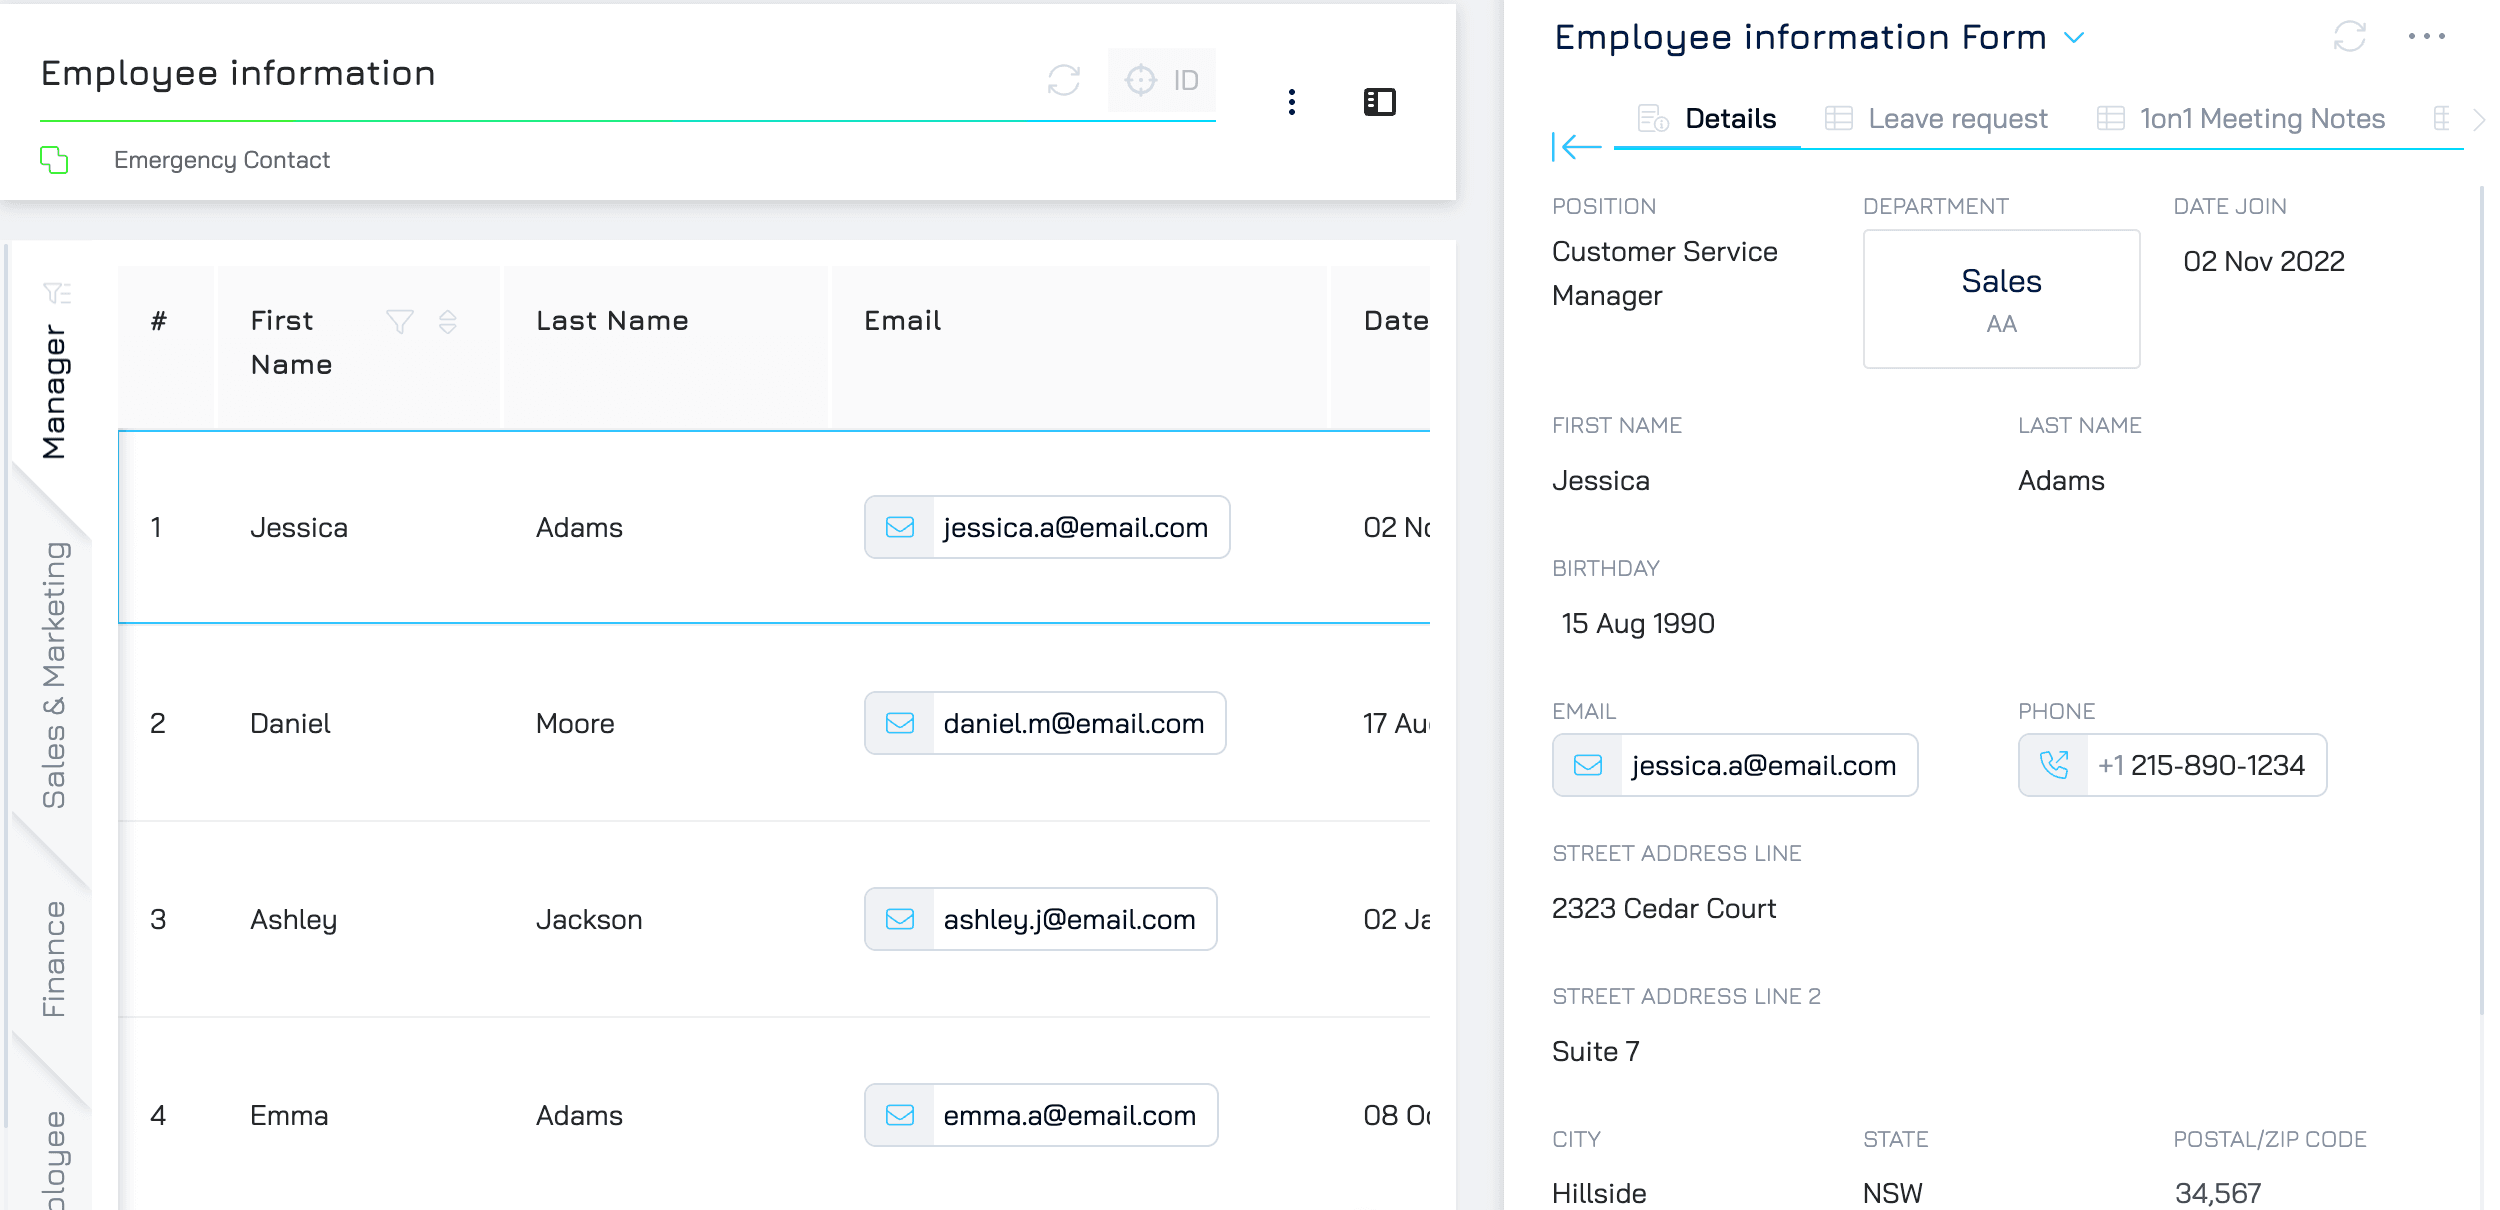
View your data using the split view
Engyn's split view allows you to view your data in two formats simultaneously: a table view for an overview and a dedicated form view for detailed information about each record.
Access Split View
Click on the icon in the top right corner of your data screen to activate the split view. It will populate the form view on one side with details from the first record in your table.
To view details for a different record, click on a specific row or navigate using your keyboard arrows within the table view.
Engyn's Form Flexibility
Engyn offers the ability to design and utilize multiple forms that connect to the same underlying dataset. This functionality allows you to tailor the information displayed in the split view form based on specific user roles, data subsets, or other criteria.
Learn more about it here.